OUR WORK
A powerful analytics tool for
managing seafarer performance

Seafarer Analytics
Driving performance. Mitigating risk. Informing career management. This analytics platform consolidates a wide range of information and establishes a framework for data driven performance evaluation.
App Type
Web
Industry
Marine Shipping
Services Provided
Discovery
-
UX-UI Design
-
Outsystem Development
Background
Our client, a major international marine shipping company, wanted to better understand employee performance and its overall impact on fleet operations. They held a substantial amount of valuable data in different locations and formats but didn’t know how to bring it together to provide meaningful insights.
The goal was two-fold: consolidate the data under one roof through integrations and APIs, then develop a framework to evaluate performance based on standardized KPIs. The solution had to provide a holistic view of performance for the individual, the vessel, and the organization as a whole.
Discovery
Given the scope and complexity of the project, a discovery phase was critical. We needed to understand the underlying business problems this platform would support. How could we build an application that would have a meaningful impact on operational performance?

Discovery outputs
User Research
Findings
UX-UI
Designs
Application
Architecture
Development
Backlog
The Solution
Our solution delivered an impressive range of high value features, to users and business alike

Performance Ranking
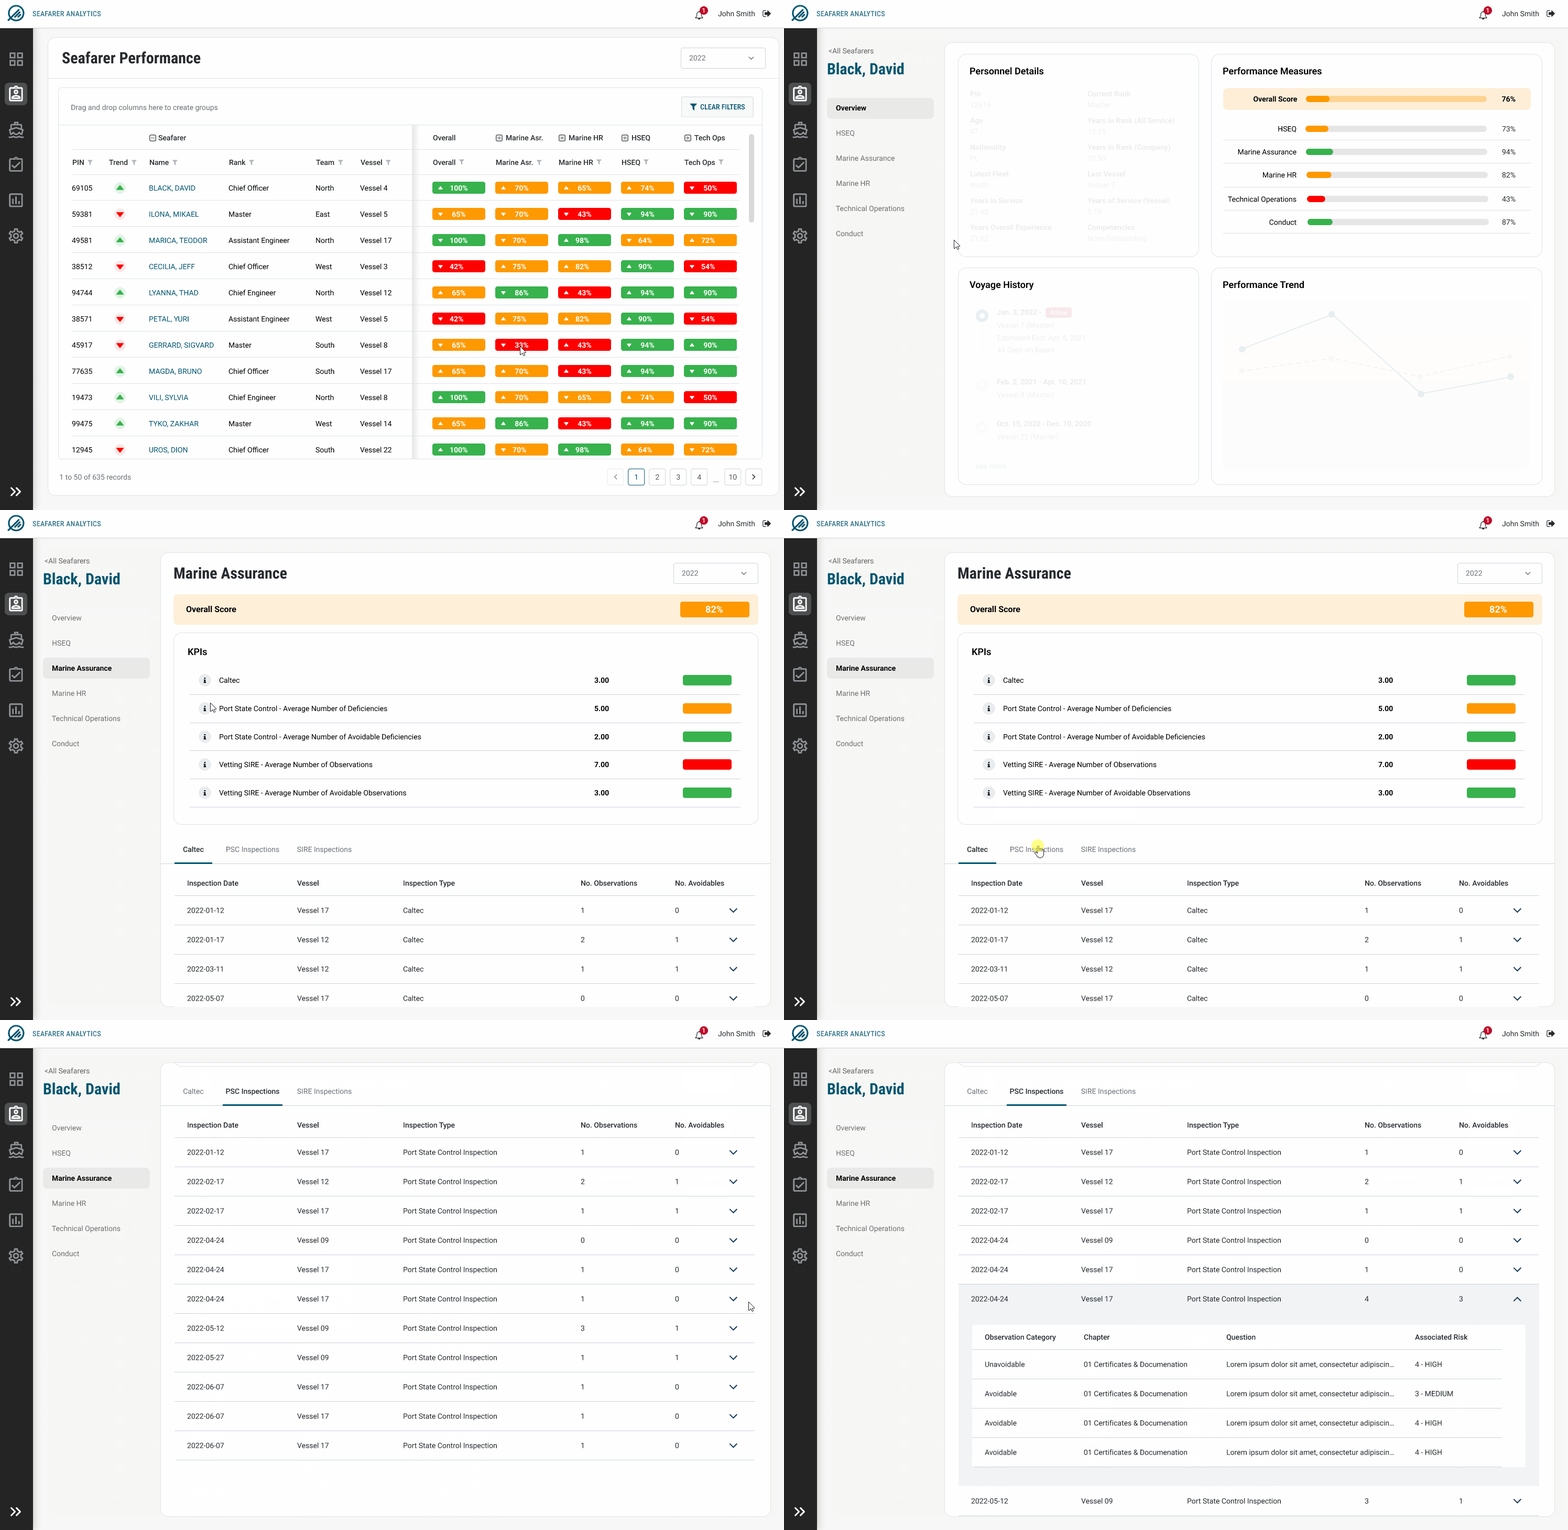
The performance grid is the heart of the application.
Absolute scores, traffic light thresholds, and year-over-year trends can be viewed across seafarers for individual KPIs and categorical rollups. Data can be sorted, filtered, and grouped to analyze different business operation areas.


Seafarer Profile
Five categories and seventeen individual KPIs were identified for evaluating performance scores.
The profile view offers a comprehensive overview of individual seafarer data. Users can drill into the categories, KPIs, and underlying events to understand how scores are determined.
Progress Tracking
Key performance management operations can be tracked and analyzed.
Data is available for training & certifications, recent promotions, and voyage appraisals to support the achievement of essential career milestones.


Data Aggregation
Individual performance is aggregated up to vessel, fleet, and overall scores to track progress at every level.
The dashboard offers a snapshot of overall fleet performance and individual score outliers to provide a high-level current state overview.
Trends & Insights
Scores are visualized across critical categories to provide insight into how performance changes over time.
This self-serve data reporting offers seven different trending views and allows us to slice and filter by KPIs, categories, and individual vessels.

Integrations & APIs
Data was pulled in through enterprise integrations and APIs to provide a central, standardized source of truth.
Data Management
To fine-tune calculations yearly, application super users can manage KPIs, weighting, and traffic light thresholds directly in the application.
Reusable Components
A branded theme and custom UI components were created with reuse in mind for future application development.
Highlights


The Result
Seafarer Analytics is a comprehensive tool for the company to manage performance at all levels: individual, vessel, fleet, and overall organization. It helps them answer critical business questions like:
“Who are the high and low performers?”
“Who needs more training?”
“Who should be promoted?”
Ultimately this information supports the organization in managing risk, nurturing personal development, and improving overall organizational operations.


